In this modern era of cricket, it’s not unusual to see staggering strike-rates, sixes being scored for fun. Cricket has seen a lot of innovations and batsmen have completely changed their approach to an innings. But when it comes to class, elegance and domination we often go by the term ” fab four”. The accepted […]

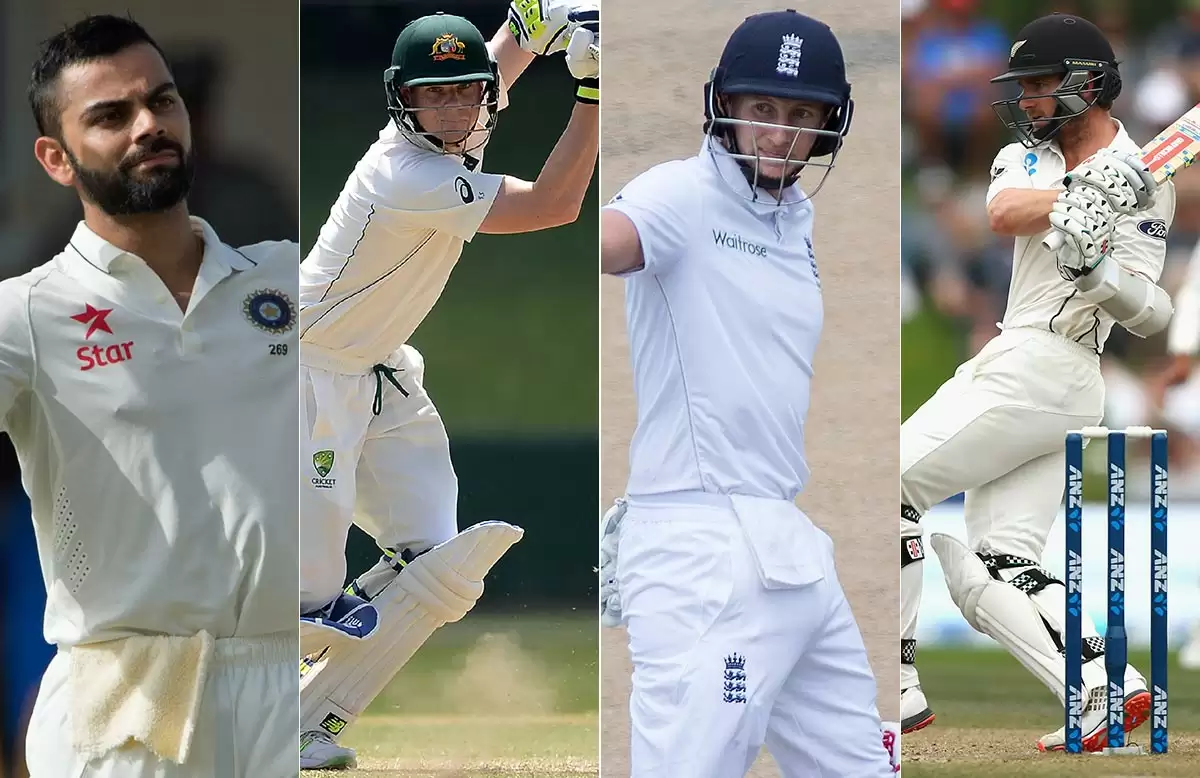
In this modern era of cricket, it’s not unusual to see staggering strike-rates, sixes being scored for fun. Cricket has seen a lot of innovations and batsmen have completely changed their approach to an innings. But when it comes to class, elegance and domination we often go by the term ” fab four”. The accepted Fab four comprises of Steven Smith, Kane Williamson, Virat Kohli and Joe Root. All these batsmen bat at either number 3 or number 4 position which is considered as the most important positions in a batting line-up.
Instead of going with the traditional method of using batting average as the main criterion, this article uses WBA(weighted batting average), Consistency index, runs against top bowlers and their stats when they come early to the crease.
The batting average is a seriously flawed metric because of the way it deals with every unbeaten innings. To get a clear picture and ability of a batsmen WBA has a slight edge over the traditional batting average because WBA doesn’t eliminate an unbeaten innings. WBA uses runs per innings (RPI). The WBA is calculated as explained below.
ALSO READ: EXCLUSIVE – Atharva Ankolekar
Let me explain with an example. If batsman A has scored 4500 runs in 89 innings his RPI would be 50.56. The scores in the 6 not out innings are 7,18,23,52,67,87. The last three innings are above RPI so they are considered as innings that resulted in a dismissal. The other 3 innings are added up and divided by RPI which gives Pro-rated value. The Weighted Batting Average of A is 51.75 (=4500/86.95). To explain, 86.95 = 83 (dismissed innings) + 3.00 (Above RPI) + 0.95 (Pro-rated: 48/50.56).

!function(){“use strict”;window.addEventListener(“message”,(function(a){if(void 0!==a.data[“datawrapper-height”])for(var e in a.data[“datawrapper-height”]){var t=document.getElementById(“datawrapper-chart-“+e)||document.querySelector(“iframe[src*='”+e+”‘]”);t&&(t.style.height=a.data[“datawrapper-height”][e]+”px”)}}))}();
The above data gives a considerable difference between batting average and weighted batting average. These numbers are fair and equitable. As usual, when it comes to batting in Test cricket Steve Smith is the master of that art. He has a whopping WBA of 56 followed by the Indian captain who has WBA just over 50.
The most common criteria used to measure consistency in test cricket is RPI (runs per innings). However, the intricacy of low not-out scores persists. but this problem is solved to some extent when we use RPT (runs per test). The benefits of using RPT is stated below.
To measure the consistency of batsmen, the two main parameters used are standard deviation and mean (runs per test). The SD indicates the dispersion of the values from the Mean. The higher the SD, the more the dispersion. Standard deviation alone is not enough to conclude the consistency of the batsmen. So, we made use of consistency index (CI) or the coefficient of variation which is obtained by dividing SD by mean (RPT). The lower the CI is, the lower the dispersion from the mean value and the batsmen are consistent. Let’s find out how this parameter works for the “fab four”.
code for Consistency index : !function(){“use strict”;window.addEventListener(“message”,(function(a){if(void 0!==a.data[“datawrapper-height”])for(var e in a.data[“datawrapper-height”]){var t=document.getElementById(“datawrapper-chart-“+e)||document.querySelector(“iframe[src*='”+e+”‘]”);t&&(t.style.height=a.data[“datawrapper-height”][e]+”px”)}}))}();
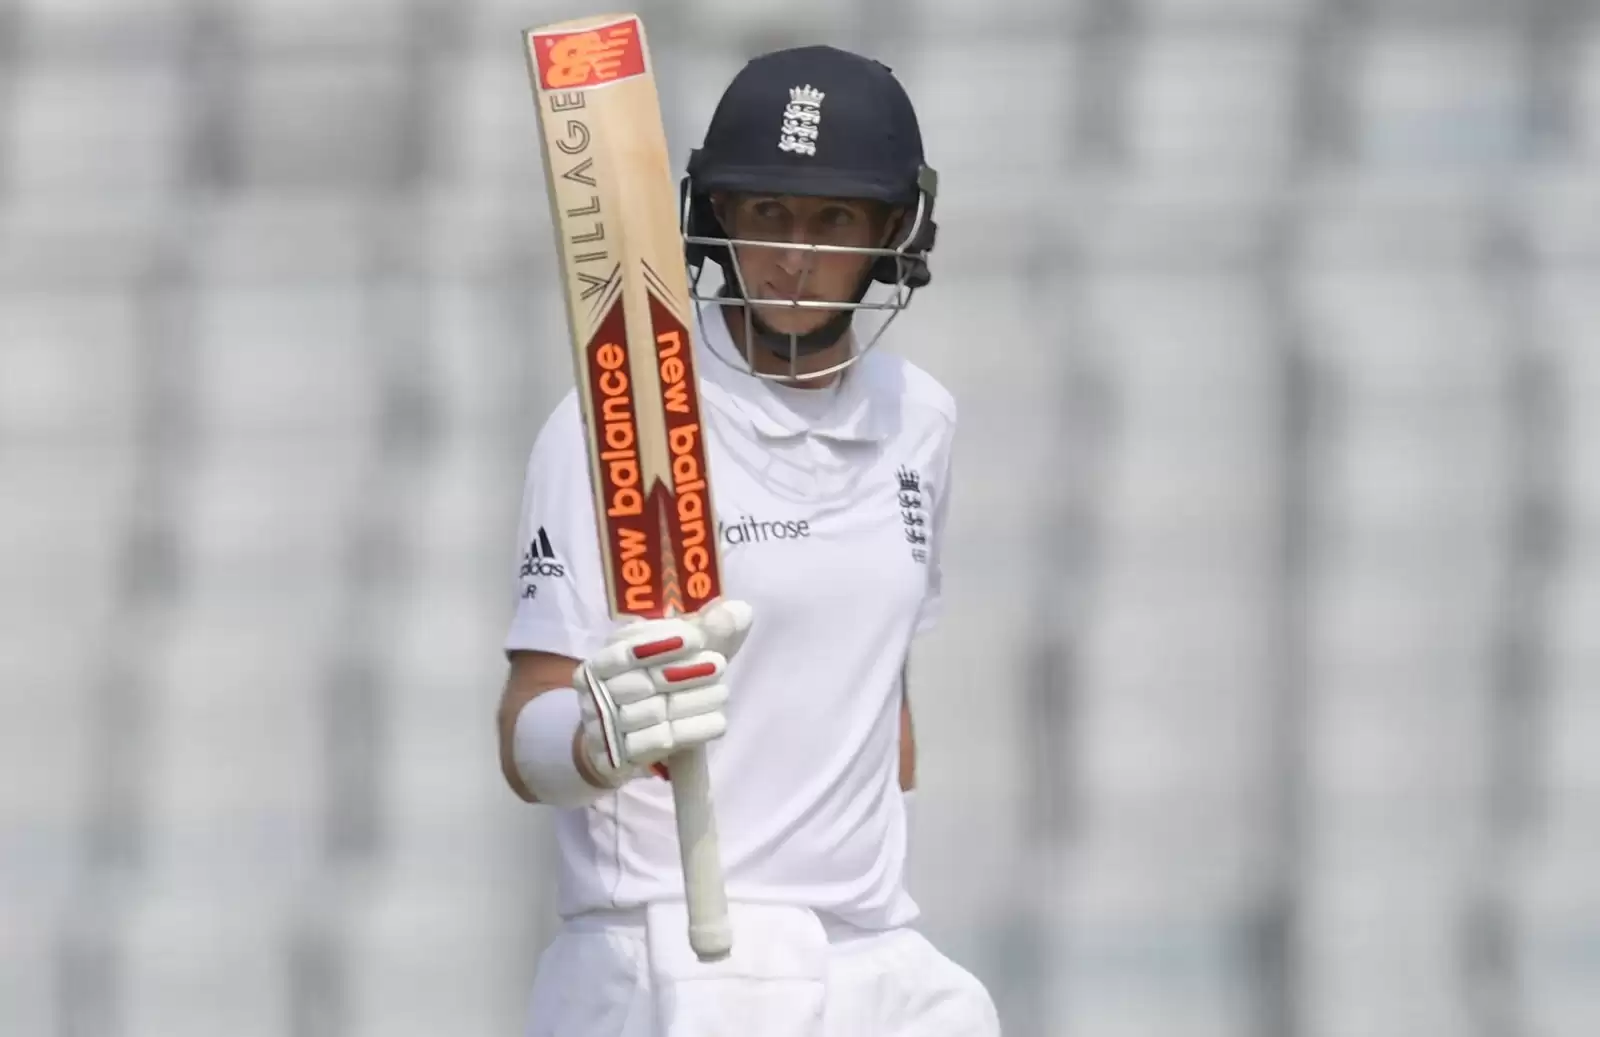
CI is just a percentage ratio between SD and mean. Lower the value of CI, higher is the consistency of the batsmen. When these batsmen are ordered according to their consistency index, the English captain emerges as more consistent. He crosses Steve smith by a small margin. In the 92 test matches that Joe Root has played, only in 12 Test matches, he failed to score at least 25% of his RPT. Steve Smith failed to reach at least 25% of his RPT in just 9 tests out of 73 tests while Kohli and Williamson failed in 16 tests out of 86 and 80 test matches respectively.
But when it comes to conversion rate, Root struggles a bit. His conversion rate is around 26.15 %, which puts him in the fourth place. The Indian captain with a conversion rate of 55.10% takes the top spot followed by Smith and Williamson with a rate of 46 % and 39.6% respectively.

In this comparison, we will get to know how these stalwarts performed against top bowlers during their career. The runs scored by these batsmen against bowlers who are having averages below or equal to 32 and took at least 30 wickets are considered. Nearly 58 bowlers fall under this criterion. Let’s now look at the numbers.
!function(){“use strict”;window.addEventListener(“message”,(function(a){if(void 0!==a.data[“datawrapper-height”])for(var e in a.data[“datawrapper-height”]){var t=document.getElementById(“datawrapper-chart-“+e)||document.querySelector(“iframe[src*='”+e+”‘]”);t&&(t.style.height=a.data[“datawrapper-height”][e]+”px”)}}))}();
From the above data, it is clear that Steve Smith dominates the top bowlers the most when compared with his counterparts. He averages 54.15 and the next batsman is placed at an average of 46.25. Kohli edges Williamson by a very small margin to take the third spot. Further, when we split this comparison, interesting numbers are observed.
!function(){“use strict”;window.addEventListener(“message”,(function(a){if(void 0!==a.data[“datawrapper-height”])for(var e in a.data[“datawrapper-height”]){var t=document.getElementById(“datawrapper-chart-“+e)||document.querySelector(“iframe[src*='”+e+”‘]”);t&&(t.style.height=a.data[“datawrapper-height”][e]+”px”)}}))}();
When we look at these batsmen’s performance against spin and fast bowling, Smith is dominating the fast bowlers with a whopping average of almost 59 against them. He is the only player in this list to have an average of over 50 against them. But when it comes to handling spinners, England’s captain and the New Zealand captain tops the chart with an average of 52.52 and 50.14 respectively.
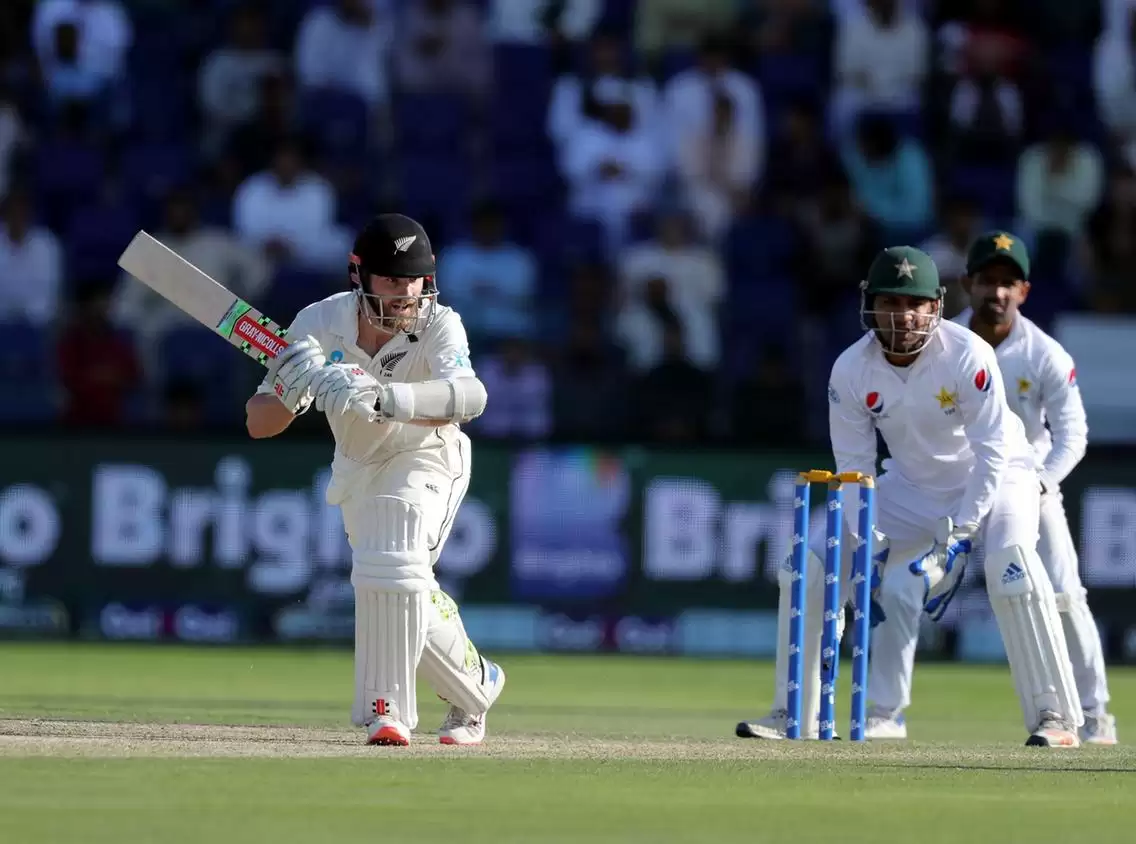
Among the spinners, Steven Smith is more troubled by Yasir Shah and Rangana Herath. But Kane Williamson dominated these bowlers. He dominated Herath by scoring 181 runs against him, being dismissed only once. He has an average of 134 and only 2 dismissals against Yasir. Surprisingly perhaps, the Indian captain’s average dips just below 40 against both types of bowlers.
As said earlier, these modern-day batting maniacs take the most important positions in their respective batting line-ups. Bringing the innings back on track after an early loss of a wicket in test cricket is an art. Let’s take a look at the numbers.
!function(){“use strict”;window.addEventListener(“message”,(function(a){if(void 0!==a.data[“datawrapper-height”])for(var e in a.data[“datawrapper-height”]){var t=document.getElementById(“datawrapper-chart-“+e)||document.querySelector(“iframe[src*='”+e+”‘]”);t&&(t.style.height=a.data[“datawrapper-height”][e]+”px”)}}))}();
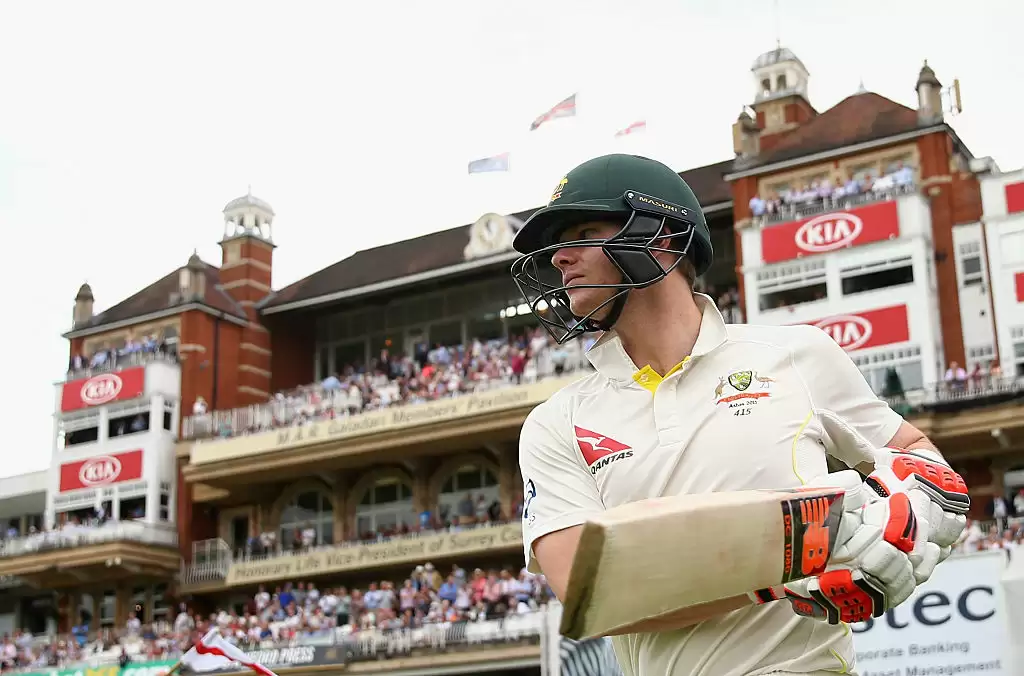
“If batting in Test cricket is a code, Steve Smith is a hacker” – that’s the conclusion we can draw from the above data. He outplays every other batter when it comes to saving the team during troubling times. The best example is 2019 Ashes in England. During that series, he used to come to the crease with team scores of 17-2, 27-2, 28-2. Langer described him as a great “problem solver”. The clear difference between England and Australia during that series is “Steven Smith”.
Next position is occupied by the Kiwi skipper with an average of 47. He scored 12 hundreds out of 21 when he came to the crease before a score of 50. 11 of which came before a score of 25. Virat Kohli’s average drops below 40 in this scenario. Still, these batsmen have a lot of game left in their career. We are lucky to witness these four players together in this era.