The ongoing World Test Championship cycle has witnessed an intense battle for the final two spots at Lord's in summer of 2023.
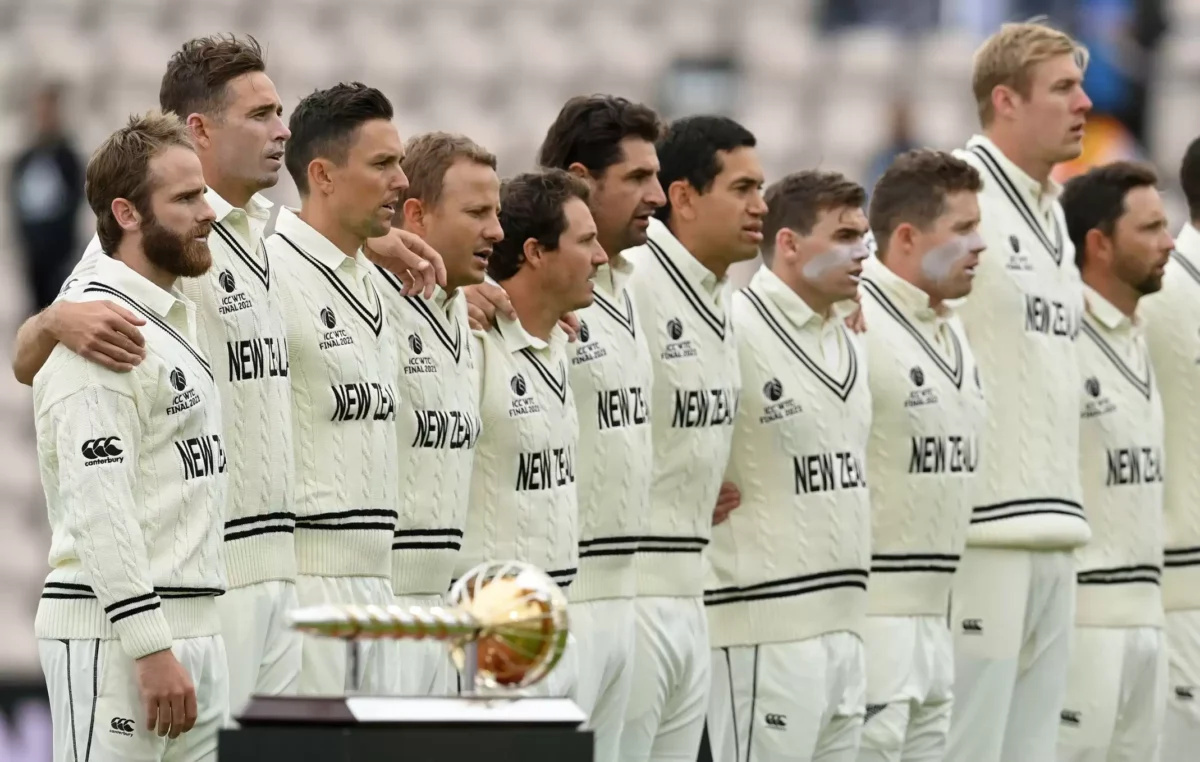
With New Zealand’s inspiring surge to the title in the summer of 2021, the inaugural cycle of the World Test Championship (WTC) came to an end.
The tournament’s new reign began with the immensely popular England-India Test series played for the ‘Pataudi Trophy’ later in the English season.
Since then, there have been 88 Tests played by the nine participating nations spanned over 34 series in the last two years as the battle to cement a spot in the marquee final in 2023 has gone way more intense and captivating for the fans.
| Position | Team | PP% | Points | Win | Lost | Drawn | Series | Penalty |
| 1 | South Africa | 71.43 | 60 | 5 | 2 | 0 | 3 | 0 |
| 2 | Australia | 70 | 84 | 6 | 1 | 3 | 3 | 0 |
| 3 | Pakistan | 58.33 | 56 | 4 | 2 | 2 | 4 | 0 |
| 4 | India | 52.08 | 75 | 6 | 4 | 2 | 4 | -5 |
| 5 | West Indies | 50 | 54 | 4 | 3 | 2 | 4 | -2 |
| 6 | Sri Lanka | 48.15 | 52 | 4 | 4 | 1 | 5 | 0 |
| 7 | England | 33.23 | 64 | 5 | 7 | 4 | 4 | -12 |
| 8 | New Zealand | 25.93 | 28 | 2 | 6 | 1 | 4 | 0 |
| 9 | Bangladesh | 13.33 | 16 | 1 | 8 | 1 | 5 | 0 |
The points table for the new cycle of the World Test Championship is determined via the percentage of points won system, where teams are placed in the standings depending on percentage of points they’ve managed to win from the total number of points they’ve contested for. Each Test match is allocated 12 points for a win, 6 for a tie and 4 in case of a draw.
In the previous cycle of WTC, each series comprised of 120 points regardless of its length, which meant a Test win accounted for 24 points in a five-match series, 30 in a four-match series, 40 for a three-game series, and 60 for the minimum mandatory series size of two matches. This system created massive debates as different teams played series of different size, leading to heavy criticism for the ICC.
Also Read: How can India make it to the WTC final 2023?
To absolve the WTC of this issue, the governing body came up with the pecentage points system after the Covid-19 pandemic wrecked the first cycle and established a fair-for-all set-up for the second cycle where regardless of the length of the series, a particular result carried equal weightage.
| Player | Matches | Innings | Not out | Runs | Highest | Average | BF | 100 | 50 | SR | 0 | 4s | 6s |
| Joe Root (ENG) | 16 | 31 | 4 | 1744 | 180* | 64.59 | 2935 | 8 | 5 | 59.42 | 3 | 201 | 3 |
| Jonny Bairstow (ENG) | 13 | 25 | 3 | 1218 | 162 | 55.36 | 1773 | 6 | 2 | 68.69 | 2 | 148 | 19 |
| Usman Khawaja (AUS) | 7 | 13 | 4 | 888 | 160 | 98.66 | 1711 | 4 | 3 | 68.69 | 0 | 91 | 4 |
| Liton Das (BAN) | 10 | 18 | 0 | 883 | 141 | 49.05 | 1589 | 3 | 5 | 55.86 | 0 | 107 | 3 |
| Babar Azam (PAK) | 8 | 14 | 1 | 856 | 196 | 65.84 | 1805 | 2 | 6 | 47.42 | 0 | 92 | 7 |
| Kraigg Brathwaite (WI) | 9 | 18 | 3 | 752 | 160 | 50.13 | 2022 | 1 | 6 | 37.19 | 1 | 85 | 1 |
| Dimuth Karunaratne (SL) | 9 | 17 | 1 | 746 | 147 | 46.62 | 1432 | 2 | 4 | 52.09 | 0 | 90 | 0 |
| Abdullah Shafique (PAK) | 6 | 11 | 2 | 720 | 160* | 80.00 | 1796 | 2 | 4 | 40.08 | 0 | 60 | 9 |
| Rishabh Pant (IND) | 10 | 18 | 1 | 720 | 146 | 42.35 | 912 | 2 | 4 | 78.94 | 1 | 82 | 15 |
| Daryl Mitchell (AUS) | 7 | 12 | 1 | 709 | 190 | 46.45 | 1433 | 3 | 4 | 49.47 | 0 | 79 | 12 |
| Player | Matches | Innings | Overs | Maidens | Runs | Wickets | BBI | BBM | Average | ECO | SR | 5s | 10s |
| Jasprit Bumrah (IND) | 10 | 19 | 328.5 | 82 | 888 | 45 | 5/24 | 9/110 | 19.73 | 2.70 | 48.3 | 3 | 0 |
| Shaheen Afridi (PAK) | 8 | 15 | 259.4 | 69 | 746 | 41 | 6/51 | 10/94 | 18.19 | 2.87 | 38.0 | 2 | 1 |
| James Anderson (ENG) | 10 | 19 | 381.0 | 119 | 868 | 40 | 5/60 | 6/106 | 21.70 | 2.27 | 57.1 | 2 | 0 |
| Nathan Lyon (AUS) | 10 | 16 | 482.1 | 108 | 1231 | 39 | 5/83 | 9/121 | 31.56 | 2.55 | 74.1 | 2 | 0 |
| Pat Cummins (AUS) | 9 | 16 | 278.5 | 67 | 769 | 35 | 5/38 | 8/79 | 21.97 | 2.75 | 47.8 | 2 | 0 |
| Tim Southee (NZ) | 9 | 18 | 367.1 | 72 | 1199 | 33 | 5/35 | 8/144 | 36.33 | 3.26 | 66.7 | 2 | 0 |
| Ollie Robinson (ENG) | 8 | 15 | 272.4 | 81 | 729 | 32 | 5/65 | 7/81 | 22.78 | 2.67 | 51.1 | 2 | 0 |
| Mohammad Shami (IND) | 9 | 17 | 267.5 | 55 | 858 | 32 | 5/44 | 8/107 | 26.81 | 3.20 | 50.2 | 1 | 0 |
| Mitchell Starc (AUS) | 10 | 19 | 294.5 | 64 | 898 | 32 | 4/33 | 6/80 | 28.06 | 3.05 | 55.2 | 0 | 0 |
|
Jayden Seales (WI) |
7 | 14 | 190.0 | 37 | 631 | 31 | 5/55 | 8/125 | 20.35 | 3.32 | 36.7 | 1 | 0 |
| Cycle | Winners | Runners-up | Player of the Cycle |
| 2019-21 | New Zealand | India | Kyle Jamieson (NZ) |
| 2021-23 | TBA | TBA | TBA |
While dominant during the league stage, India failed to cross the last hurdle and conceded the marquee WTC final in Southampton last year to New Zealand, who had struggled away from home but taken enough points from matches in familiar terrain to make the cut for the summit clash. Australia may have piped the Kiwis to the final if not for losing critical points due to over-rate regulations. New Zealand’s Kyle Jamieson, who made his Test debut during the cycle, was rewarded with the ‘Player of the Tournament’ trophy for his all-round display.
Sri Lanka vs Pakistan
1st Test – Galle – July 16-20
2nd Test – Colombo – July 24-28
England vs South Africa
1st Test – Lord’s – Aug 17-21
2nd Test – Manchester – Aug 25-29
3rd Test – The Oval – Sept 8-12
South Africa vs West Indies
1st Test – TBA
2nd Test – TBA
Bangladesh vs India
1st Test – TBA
2nd Test – TBA
Australia vs West Indies
1st Test – Perth – Nov 30-Dec 4
2nd Test – Adelaide – Dec 8-12
Pakistan vs England
1st Test – TBA
2nd Test – TBA
3rd Test – TBA
Pakistan vs New Zealand
1st Test – TBA
2nd Test – TBA
Australia vs South Africa
1st Test – Brisbane – Dec 17-21
2nd Test – Melbourne – Dec 26-30
3rd Test – Sydney – January 4-8
New Zealand vs Sri Lanka
1st Test – Christchurch – Mar 9-13
2nd Test – Wellington – Mar 17-21
India vs Australia
1st Test – TBA
2nd Test – TBA
3rd Test – TBA
4th Test – TBA